Our responsibility
Sustainable and ethical action is a matter of course for us.
Learn more
Alternative Investments
The sharp rise in energy prices is currently shaping developments in financial markets. From today’s perspective, it is not possible to reliably assess how the conflict in Iran and a potential closure of the Strait of Hormuz will evolve. Rather than speculating, it is worth taking a look back: in the past, oil crises have repeatedly occurred in connection with military conflicts. Based on the chart below, which shows the oil price since the 1970s as well as key energy crises, we analyze how markets reacted at the time and whether any patterns can be identified that may help investors.
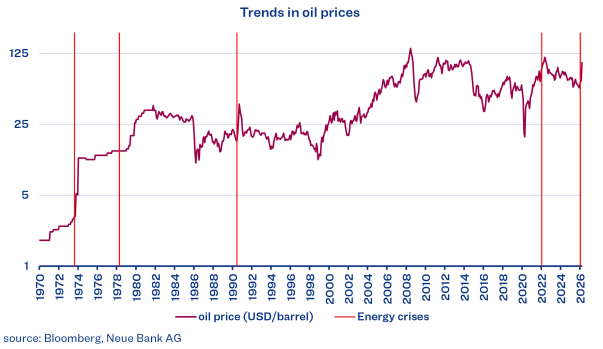
At the beginning of the 1970s, there was no standardized futures trading in crude oil. No continuous market prices were quoted, which is why the prices shown in the chart remained unchanged over longer periods of time. With the first energy crisis, triggered by the Yom Kippur War in autumn 1973 and the subsequent oil embargo, the price per barrel rose sharply. A similar dynamic was observed with the onset of the Islamic Revolution in Iran in 1978, which brought the mullah regime to power. Shortly thereafter, the First Gulf War between Iraq and Iran followed, increasing uncertainty in energy markets for years and repeatedly leading to spikes in oil prices. In August 1990, Iraq’s invasion of Kuwait marked the beginning of the Second Gulf War. A coalition led by the United States and legitimized by a UN resolution launched a counteroffensive in early 1991, which ultimately resulted in Iraq’s defeat. Oil prices rose significantly at the start of the conflict, but declined just as quickly following Iraq’s def. The most recent major energy crisis was triggered by Russia’s invasion of Ukraine in February 2022. While oil prices also increased in this case, the rise was significantly less pronounced than in the previously described episodes. The increase in gas prices, however, was much more substantial. Europe increasingly sourced its gas from the United States and the Gulf region instead of Russia, while Russia redirected its exports more strongly the East (including China and India). Prices began to stabilize again towards the end of 2022. The most recent military escalation between the United States, Israel, and Iran has once again led to an increase in oil prices. Experiences from previous energy crises suggest that oil prices are likely to normalize over time if the current conflict deescalates or comes to an end—however, the timing and magnitude remain uncertain.
Economic Activity
A chart that has repeatedly appeared in financial media in recent months compares the inflation dynamics of the 1970s—shaped by two energy crises—with those of the 2020s, which are likewise marked by two military conflicts that are influencing energy prices and inflation.
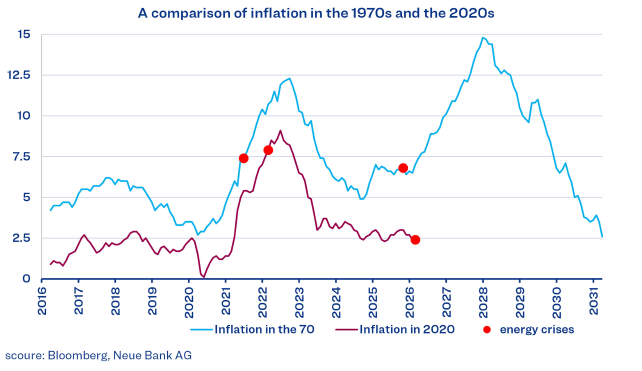
With the above comparison, we do not intend to create alarm, but rather to illustrate that supply shortages in fossil fuels can still have a significant impact on inflation. However, the surge in inflation in 2021/22 was not solely driven by higher energy prices, but also resulted from disrupted supply chains following the pandemic and strong catch-up effects in demand, supported by a prolonged period of relatively accommodative monetary policy. Nor do we wish to suggest that, following the recent easing of inflation, a renewed surge in prices—similar to the 1970s—is inevitable. From today’s perspective, however, we consider the risk of another energy-driven wave of inflation to be elevated. The key factor will be whether a lasting disruption in energy supply occurs.
Bonds
The development of yields on 10-year government bonds must today be viewed in a significantly different environment than during previous energy crises: government debt levels are much higher, and accordingly, the interest burden weighs far more heavily on many economies.
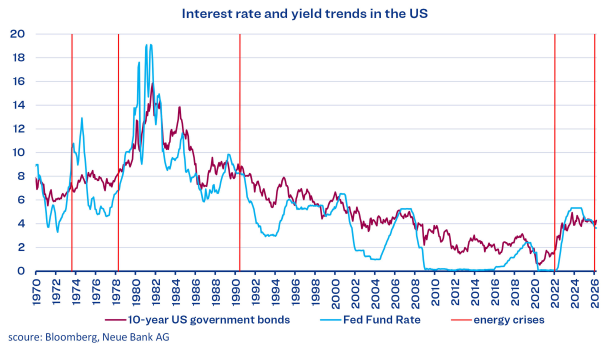
Rising energy prices have regularly led to higher inflation in past crises— and consequently to rising yields. This put pressure even on high-quality bonds. The effect was particularly pronounced in 2022, when yields rose sharply from historically low levels and the ongoing interest income was far from sufficient to offset price losses. Yields have risen again more recently, though—compared with 2022—so far to a manageable extent. How strongly this effect will develop in the future depends largely on the duration and intensity of any potential energy price surge. During periods of elevated inflation, central banks have often raised key interest rates significantly. Short-term rates frequently exceeded long-term yields, resulting in an inverted yield curve—typically a signal of an emerging recession.
Equities
Higher energy prices, rising inflation, increasing yields and interest rates, and concerns about a recession often lead to corrections in equity markets. The historical performance of the S&P 500 since the 1970s, however, shows that the magnitude and duration of such setbacks have varied widely. Key factors include how long energy supply is actually disrupted and the extent to which alternative suppliers can step in.
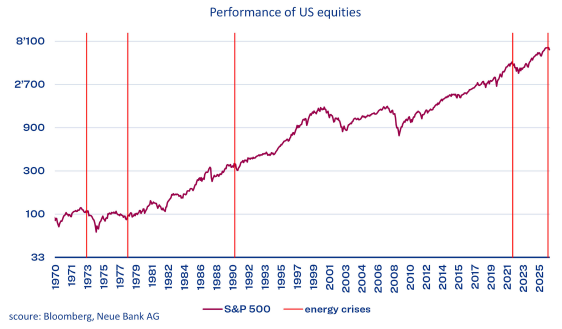
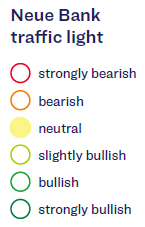
The numerous uncertainties that wars in regions with significant fossil fuel resources bring make reliable forecasts for future equity market developments difficult. In this environment, we are guided consistently by the Neue Bank traffic light system. Last month, it indicated increased uncertainties in the equity markets and switched to yellow (neutral). Accordingly, we have slightly reduced risks in the portfolios in a targeted manner.
Currencies
In times of crisis, investors traditionally seek safe havens. Contrary to some expectations, the US dollar has been in demand again since the attack on Iran, gaining against the euro and the Swiss franc. This occurred despite the high US debt levels and the increasing strain that rising yields place on debt sustainability. In a longer-term perspective, however, the recent strength of the dollar is relativized: over the past three years, the Greenback has lost significant value. Our measurements so far show no reversal of this trend. Accordingly, we continue to actively hedge parts of the USD exposure.

