Our responsibility
Sustainable and ethical action is a matter of course for us.
Learn more
Shares
Share valuations on the US markets are at or near their all-time highs. This begs the question: are we in a bubble? To assess this, the financial press often refers to two well-known indicators – the so-called Buffett indicator and the cyclically adjusted price-earnings ratio (CAPE) developed by Nobel Prize winner Robert Shiller. But how useful are such long-term comparisons? Let’s start with the benchmark named after legendary investor Warren Buffett, which he once described as probably the best single indicator. It compares the market capitalisation of all US companies to the gross domestic product (GDP) of the United States. The basic idea is that if the total valuation of the stock market significantly exceeds economic growth, the market is overvalued. However, there are good reasons to view this indicator critically today. Many US companies now generate a large part of their revenues abroad – these are included in market capitalisation, but not in US GDP. This means that the indicator
rises structurally even if there is no overvaluation. Even Buffett and his long-time partner Charlie Munger later emphasised that they do not attach great importance to this indicator in their investment decisions. Another frequently cited valuation metric is the Shiller P/E ratio (also known as CAPE). It calculates the share price in relation to the inflation-adjusted average earnings of the last ten years. Here, too, the current values are historically high – only during the dot-com bubble in 2000 were they even higher. However, this metric also has certain weaknesses. Critics point out that accounting standards (US GAAP) changed significantly in the 1990s. Earnings are reported lower today, which artificially increases the CAPE. Economist Jeremy Siegel therefore suggests using alternative earnings metrics, such as those from national accounts. On this basis, valuations would be significantly lower. Another reason why historical comparisons can be assessed differently today concerns the costs of investing. A hundred years ago, the cost of maintaining a diversified portfolio alone was around 2% per annum. Thanks to ETFs (since 1993) and low-cost online brokers (since 2013), this figure is now close to zero. With an average real return expectation of 7%, this is a difference that should not be underestimated – and a possible reason why investors today are willing to pay more for shares.
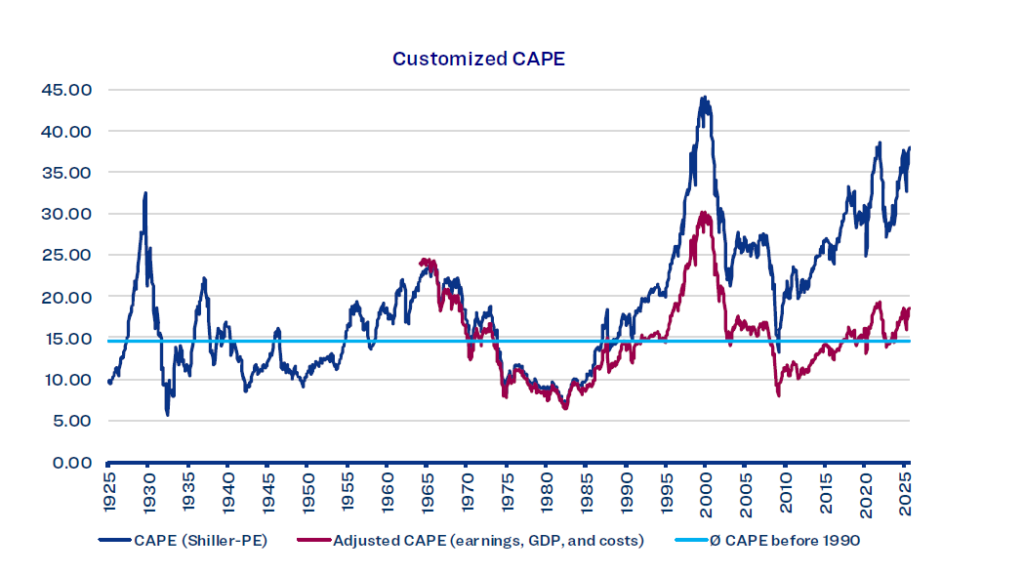
In the chart above, we have adjusted the CAPE as described. From the 1990s onwards, the valuation gap widens. Although the current valuation
is above the long-term average, it is still well below previous excesses. Only time will tell which valuation method is closer to the ‘truth’. Critics might argue that arguments in favour of adjustment are typical of the ‘this time is different’ mindset, i.e. the assumption that this time everything is different. In the financial world, this is considered a particularly risky idea. At the same time, there are regional differences: while the US currently has high valuations, many other markets – such as those in Europe or emerging markets – are fairly valued or even undervalued. As a general rule, valuations are only of limited use as a short-term timing indicator. Studies show that they explain only about 3% of returns over the next twelve months. However, when looking at a ten-year period, this figure rises to up to 80%. Based on the classic Shiller P/E ratio, the return prospects for US equities over the next ten years would be very modest. However, the period after 1990 shows that, especially in phases of high valuations, future returns were often underestimated, which in turn could be an indication that certain adjustments are indeed justified.
Economic cycle
Around two-thirds of bear markets in the US occur in the context of an economic recession. True to the saying, ‘When America sneezes, the rest of the world catches a cold,’ other regions naturally also suffer from this weakness. In addition to monitoring valuations, a key focus is therefore on identifying recessions as early as possible in order to proactively manage market risk in the equity portfolio and minimise losses. An inverted yield curve (2-year minus 10-year US Treasury yields) has heralded a recession at an early stage in each of the last 50 years:
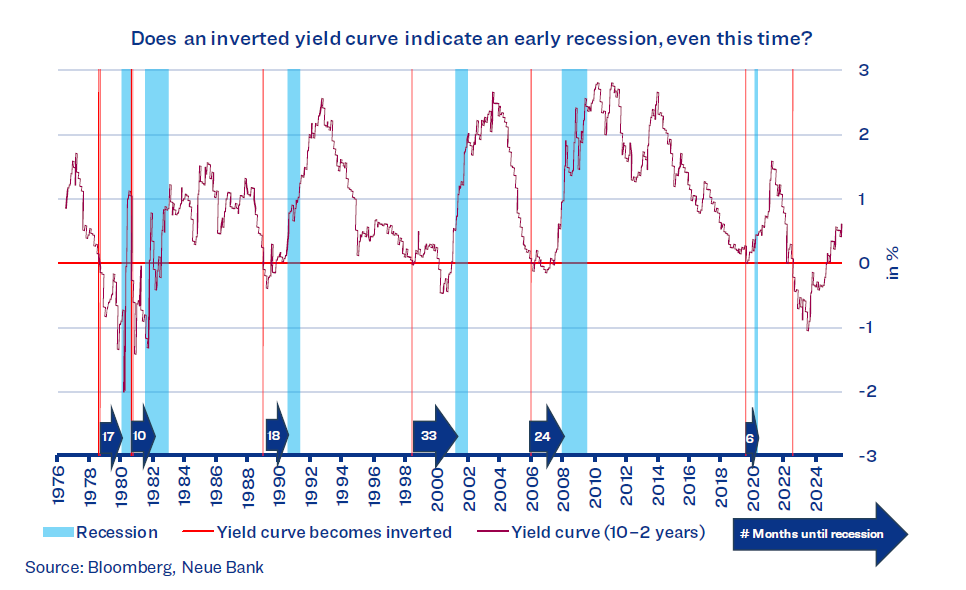
As the above chart shows, the last six recessions were signalled 6–33 months in advance. To avoid reacting prematurely, it is advisable to wait with tactical adjustments until other indicators confirm an economic downturn. Such confirmations also occurred after 2022, but without an official recession (National Bureau of Economic Research). One key pillar does not confirm the weakness: the labour market. The unemployment rate has risen only moderately to date. With the yield curve having inverted more than 38 months ago and now returning to normal, there is speculation for the first time in around 50 years that the yield curve may have delivered a so-called ‘false signal’.
Bonds
The bond market is also showing no signs of recession. The yield premium for US high-yield bonds remains at a level that does not reflect any serious economic concerns. In Europe, the failure of Prime Minister François Bayrou’s budget plans in parliament caused unrest. As a result, France now has to pay higher interest rates than Greece for 10-year bonds. The Greeks have now regained investment grade status, but unlike the markets, they are still rated lower than the French by the rating agencies.
Currencies
The Swiss franc (CHF) is the ultimate safe haven. Since 1970, it has gained more than 3% p.a. against foreign currencies on a trade-weighted basis, excluding any interest income. Against the major currencies, it is trading close to all-time highs without exception, despite the Swiss National Bank’s zero interest rate policy, which is now back in force. As many other countries (the US, Germany, etc.) are also experiencing a sharp rise in public debt alongside France, this is unlikely to change much for the time being. Accordingly, we have also entered into foreign currency hedges for the CHF portfolios we manage.
Alternative investments
The same applies to gold as to the Swiss franc. It also represents security.
Many countries that want to reduce their exposure to the US dollar are building up their gold reserves. Here too, as long as countries continue to increase their debt almost unchecked, this trend is likely to continue. We remain positioned via exchange-traded commodities (ETCs).

